Daily Leverage Certificates
DLC Hotline: (65) 6226 2828
Market Commentary (Hong Kong)
For the week ending 11 August 2023
Dollar Index DXY resisted by 102.80; Fitch downgraded US’s credit rating to AA+. Nasdaq closed this week’s session at three weeks’ low, the first major setback since February this year.
● Sales of China-made NEVs hit 3.65 million in H1 2023 and account for 60% of the global market.
● Australia took step towards a cashless economy as all four major banks limited withdrawals, took $1bn worth of notes out of circulation.
● Russia and Qatar will use local currencies for bilateral trade.
● China property developer Country Garden misses bond payment.
● China cracks down on the healthcare sector in anti-corruption campaign.
● China exported 88000 new-energy passenger vehicles in July, up 80% yoy.
● China’s Ministry of Human Resources and Social Security launched a four month campaign to boost youth entrepreneurism.
● China’s CPI fell in July the first time in two years.
● Biden signed an executive order restricting US investment in China in fields such as semiconductors and quantum computing.
Hang Seng Index closed this week at 19075, down 464 points or 2.38%. The index continues to send out mixed signals that test the conviction of investors. By week’s close the index printed a three-candle bearish reversal pattern but is still above a multiple-week support resting near Q1-low of this year. Shorter moving averages 10, 20 and 50-Day SMAs have printed respective golden crosses. Additionally the index has broken a downward trendline which could turn into a supporting element. This setup is sending mixed signals so investors may have to choose one setup and stay with it faithfully.
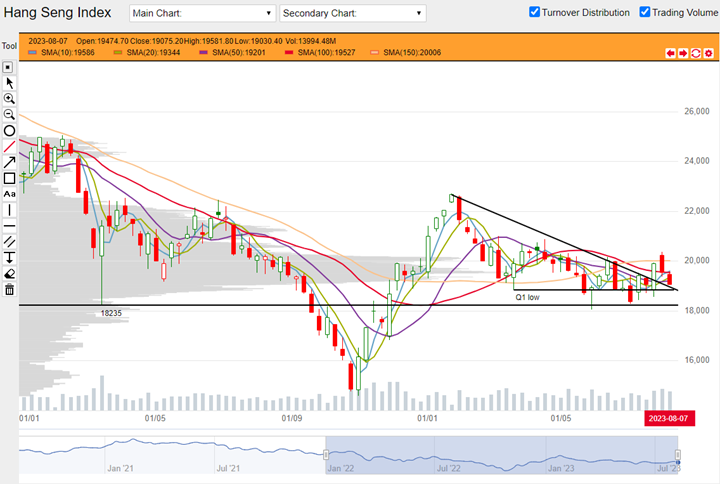
HSI weekly chart from 03 January 2022 to 11 August 2023 (Source: DLC.socgen.com)
Hang Seng Tech closed the week at 4524, down 224 points or 4.98%. Its moving averages are placed in a bullish setup and when we compare last week’s high with the top made in mid-June, it has clearly printed a higher swing high. These are features that are associated with further gains. Look for any reaction to 4200, if not support could come from any of the moving averages currently placed below.
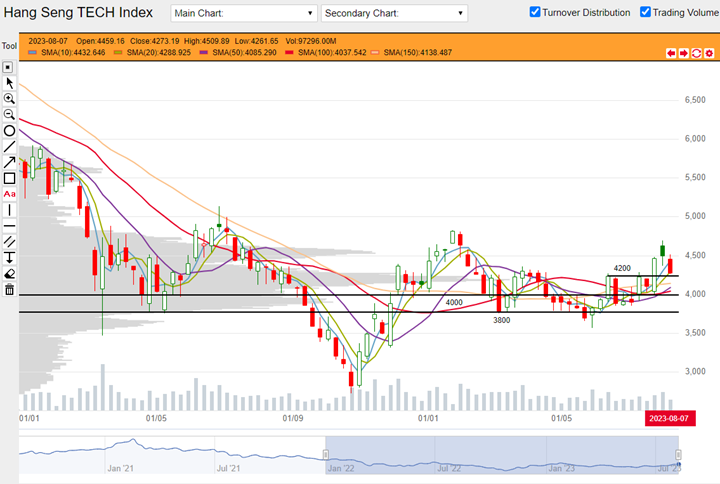
HSTech weekly chart from 03 January 2022 to 11 August 2023 (Source: DLC.socgen.com)
Dow Jones Industrial Average closed at 35281, up 216 points or 0.62%. Nasdaq closed at 15028, down 247 points or 1.62%. Moving averages for both indices are still set up in a way that is associated with further gains. Following some weakness over the past two weeks, both indices have softened somewhat and have retraced to their 20 Day SMA. Nasdaq is showing more weakness dragged down by the Biden admin’s policies of sanctioning China’s chip and semiconductor industry. In the short run, these policies appear to hurt the bottom line of American chip makers as well as they hurt Chinese players. In the NEV segment, Chinese players are catching up despite Tesla’s first mover advantage.
The next FOMC meeting is scheduled on 20 September 2023.
Fed funds futures on rate hike probability by next Fed meeting as at this week’s close:
● 90.0% probability of no change | 10.0% probability of 25 basis points hike
Fed funds futures on rate hike probability by next Fed meeting based on last week’s close:
● 87.5% probability of no change | 12.5% probability of 25 basis points hike
Data indicates a peak rate of 6.00% until June 2024. A rate cut could appear as early as December.
Shanghai Composite closed at 3189, down 99 points or 3.01%. Shenzhen closed at 10809, down 429 points or 3.82%. Both indices closed strong with three-candle bearish reversal patterns on the weekly chart. Both also closed below their basket of moving average indicators. This is a setup associated with further losses.
Economic data in coming week:
1. Tuesday 15 August 2023 US reports Retail Sales and Empire State Manufacturing Index.
2. Tuesday 15 August 2023 China reports Retail Sales.
3. Wednesday 16 August 2023 UK reports CPI.
4. Thursday 17 August 2023 US releases FOMC meeting minutes, reports Unemployment Claims.
Other news:
● CK Asset bought back shares.
● CNOOC made a new 52-week high. CSPC Pharmaceutical and Sino Biopharmaceutical made new 52-week low.
● BYD Chairman Wang Chuanfu called on Chinese automakers to unite in a global push.
● Geely and Baidu’s units created a NEV JV called Jiyuyue Automobile Technology.
Technical observations
Geely 175.hk retraces, moving averages bullish.
Note chart features:
1. Geely printed a tight horizontal range between $9.20 and $10.15 between mid-March and mid-July this year (shaded in gray). This range was broken out a week before last on high volume. $11.40 is a level drawn from previous swing highs and swing lows. It is possible this could be a potential resistance. Price returned back below $10.15 this week. Price should reveal to us next week whether price action over the last three weeks is a ‘break and throwback’ action or a ‘break and failed break’ action i.e. price will return back to the shaded channel or not.
2. Apart from the 150 Day SMA (yellow), all the other moving averages have printed golden crosses which is a feature associated with further gains.
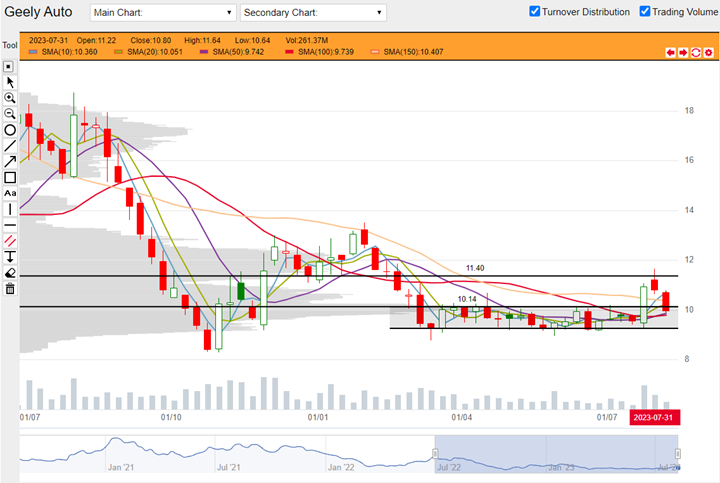
Geely 175.hk weekly chart from 04 July 2022 to 11 August 2023 (Source: DLC.socgen.com)
Underlying Index/Stock |
Underlying Chg (%)1 |
Long DLC (Bid Change%2) |
Short DLC (Bid Change%2) |
|---|---|---|---|
| Hang Seng Index (HSI) | +0.40% | B00W (+0.86%) | VXRW (-0.35%) |
| Hang Seng TECH Index (HSTECH) | -0.93% | YPCW (-6.25%) | Y9GW (+2.07%) |
| Geely Auto (0175.HK) | +4.79% | DRRW (+22.78%) |
Brought to you by SG DLC Team
This advertisement has not been reviewed by the Monetary Authority of Singapore. This advertisement is distributed by Société Générale, Singapore Branch. This advertisement does not form part of any offer or invitation to buy or sell any daily leverage certificates (the “DLCs”), and nothing herein should be considered as financial advice or recommendation. The price may rise and fall in value rapidly and holders may lose all of their investment. Any past performance is not indicative of future performance. Investments in DLCs carry significant risks, please see dlc.socgen.com for further information and relevant risks. The DLCs are for specified investment products (SIP) qualified investors only.
Full Disclaimer - here